Taas-MapView : See Your Entire Operation at a Glance

Taas-MapView turns your facility blueprints into a live operations dashboard. Upload your floor plans, draw your location boundaries, and instantly see where every asset is — from a global multi-site view down to a specific shelf or workstation. Spot exceptions visually. Find anything in seconds.

Taas-MapView comes in two views:

  1. WIP Map View — real-time visibility into your work orders and production status (available with Manufacturing Intelligence)
  2. Asset Map View — real-time visibility into your assets across all locations
Book a Demo
Technology

MapView™ - See Your Entire Operation - At a Glance

MapView™ turns your facility blueprints into a live operations-floor digital twin. Upload your floor plans and instantly see where every asset and job is — from a global multi-site view down to a specific shelf or workstation. Spot exceptions visually. Find anything in seconds. Act like you are standing right there on your shop-floor.

What you can do with MapView™:
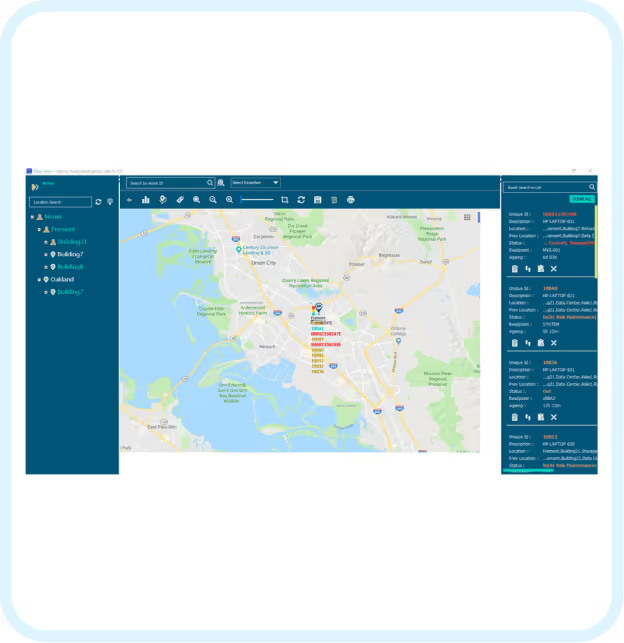
  • See your whole operation on one screen — Navigate across sites, buildings, and floors on your actual blueprints and production lines
  • Find any asset instantly — Search by attribute or status and MapView highlights every match on the map
  • Spot problems before they escalate — Exceptions appear visually so nothing gets missed in a list
  • Create tasks on the spot — Assign work to floor staff directly from the map, no separate system needed
TaaS-MapView interface displaying geographic asset tracking with site navigation and real-time job workflow monitoring
Benefits

Global View, Granular Control

From a world map down to a specific shelf, all on your actual blueprints

Spot Exceptions at a Glance

Damaged, misplaced, and missing assets flagged visually on the map

Drag & Drop Floor Configuration

Upload blueprints and draw location boundaries without IT help.

What you can do with Asset MapView

01

See your whole operation on one screen

Navigate from a global map of all your sites down to individual buildings, floors, and sub-locations — all on your actual blueprints.

02

Find any asset instantly

Search by asset name or part number and MapView highlights every match on the map, complete with exception status.

03

Spot problems before they escalate

Damaged, misplaced, and missing assets appear visually on the map with counts — so nothing gets buried in a list.

04

Create tasks on the spot

See an exception? Assign a task directly to an operator from the map — no separate system needed.

05

Smart Locations

Locations with fixed RFID readers automatically track asset movement in and out in real time — no manual scanning required.

06

Save your most-used views

Bookmark frequently visited locations as favorites for instant one-click navigation.

AI MapView dashboard

See Bottlenecks Before They Stop Your Line

Stations pulse when capacity thresholds are exceeded.

Track Every Work Order in Real Time

See exactly where every job is, what stage it's at, and what exceptions it's carrying.

Visual Diagnostics, Real-Time Solutions

Troubleshoot exceptions across both asset and production views in one place.

What you can do with WIP MapView

01

See your production flow in real time

Switch between Route View and Location View to see your floor the way that makes sense for what you're checking. Route View shows work orders moving through task stations in sequence. Location View shows the same data organized by physical location.

02

Spot bottlenecks before they escalate

Each station shows the number of active work orders and flags congestion when capacity thresholds are exceeded — so you can act before a bottleneck delays your line.

03

Track exceptions across the floor

Late, at-risk, and rework work orders are flagged visually across the map — no hunting through lists to find what needs attention.

04

Drill into any work order instantly

Click any station to see which work orders are active, their progress, task history, and what exceptions they're carrying.

05

Filter by customer or sales order

Search by work order, part number, customer, or sales order to focus the map on exactly what you need to see.

06

Understand your production routes

Strict routes enforce task sequence — every step must be completed in order. Non-strict routes allow tasks to run in parallel when there's no dependency between them.

MI dashboard
Map visualization icon for location-level asset tracking
Map your World, Visually
Visual drag & drop of locations at the region, building & shop-floor level
Efficient tracking icon for workflow and sub-location monitoring
Efficient Tracking
In-building tracking of assets and workflows by sub-location and status
Visual diagnostics icon for real-time operational monitoring
Test Before You Invest
Reduce risks, costs & accelerate proof-of-concepts for complex IoT deployments
Global view icon for multi-site asset management control
Global View, Granular Control
View assets by
sub-location across multi-site deployments on their respective maps
Visual diagnostics icon for real-time service troubleshooting
Visual Diagnostics, Real-Time Solutions
Troubleshoot services leveraging EdgeView™ device monitoring and view exceptions visually in MapView™

What you can do with MapView™

01
See your whole operation on one screen

Navigate from a global map of all your sites down to individual buildings, floors, and sub-locations — all on your actual blueprints.

02
Find any asset instantly

Search by asset name or part number and MapView highlights every match on the map, complete with exception status.

03
Spot problems before they escalate

Damaged, misplaced, and missing assets appear visually on the map with counts — so nothing gets buried in a list.

04
Create tasks on the spot

See an exception? Assign a task directly to an operator from the map — no separate system needed.

05
Smart Locations

Locations with fixed RFID readers automatically track asset movement in and out in real time — no manual scanning required.

06
Save your most-used views

Bookmark frequently visited locations as favorites for instant one-click navigation.

What you can do with WIP MapView™

01
See your production flow in real time

Switch between Route View and Location View to see your floor the way that makes sense for what you're checking. Route View shows work orders moving through task stations in sequence. Location View shows the same data organized by physical location.

02
Spot bottlenecks before they escalate

Each station shows the number of active work orders and flags congestion when capacity thresholds are exceeded — so you can act before a bottleneck delays your line.

03
Track exceptions across the floor

Late, at-risk, and rework work orders are flagged visually across the map — no hunting through lists to find what needs attention.

04
Drill into any work order instantly

Click any station to see which work orders are active, their progress, task history, and what exceptions they're carrying.

05
Filter by customer or sales order

Search by work order, part number, customer, or sales order to focus the map on exactly what you need to see.

06
Understand your production routes

Strict routes enforce task sequence — every step must be completed in order. Non-strict routes allow tasks to run in parallel when there's no dependency between them.

Frequently Asked Questions

Yes. Upload your floor blueprints and draw location boundaries directly on the plan. MapView then shows asset counts and exceptions inside each zone — drill all the way down from site to building to floor to shelf.

Yes. Search by asset name or part number and MapView filters the map to show only matching assets and their exceptions.

Yes. When you spot an exception, you can assign a task to an operator directly from the map — including the location, asset details, and what needs to be done.

A Smart Location is any zone where fixed RFID readers have been installed. These locations automatically track assets moving in and out in real time — no handheld scanning needed.

Route View shows your production flow as a sequence of task stations — how work orders move through your process. Location View shows the same work orders organized by physical location on your floor. Use whichever gives you the clearest picture of what you need to check.

Three types: Late (missed deadline), At Risk (in danger of missing deadline), and Rework (sent back to a previous task). All three are visible across the map without needing to open individual work orders.

Each station has a configurable capacity threshold. When active work orders exceed that threshold, the station is flagged as congested — giving you an early warning before the backup impacts delivery.

Frequently Asked Questions

Can MapView show the physical location of assets?
FAQ ArrowFAQ Arrow
Can you create tasks from MapView?
FAQ ArrowFAQ Arrow
Can you search for assets in MapView?
FAQ ArrowFAQ Arrow